IdPClusterIssues
Table of Contents
Advanced Streamlining and Configuration
The most important issues for all cluster deployers are:
1. Managing the Disk Garbage Collector.
2. Balancing JVM memory settings with your hardware capabilities.
3. Configuring server reconnect parameters to handle short cluster disconnect situations.
These are discussed below in the Streamlining Production Configuration section. The recommended settings for most deployments are described here.
Issues for advanced deployments are covered below that in the Advanced Configuration and Issues section. This section covers issues that arise for large-scale deployments, plus general information regarding tuning and configuration issues learned from detailed load testing.
Streamlining Production Configuration
Disk Garbage Collection (DGC)
The Terracotta server stores the shared object graph on disk. As objects get garbage collected from the memory of the client IdP JVMs, these objects can be removed from the disk cache. The Terracotta server will by default attempt to remove these objects every hour. To do this it will have to iterate over the entire collection. During most of the day, many of these objects are not expired (where session lifetime is long) and so processor time will be wasted and bog down the machine. To fix this, run the disk garbage collector at a convenient time in the middle of the night when login activity is low.
Here are the steps to configure this:
- Turn off automatic garbage collection (this is done inside the existing <dso> tag):
Terracotta garbage collection configuration
<dso> <persistence> <mode>permanent-store</mode> </persistence> <garbage-collection> <!-- default: enabled=true Set this to false to force manual-only runs via run-dgc.sh crontab entry at times which are not busy --> <enabled>false</enabled> <!-- default: verbose=false --> <verbose>true</verbose> <!-- default: interval=3600 --> <interval>3600</interval> </garbage-collection> </dso> - Set an automatic nightly process, such as a cron job, to run the external script which triggers a DGC:
Sample crontab entry
30 2 * * * JAVA_HOME=/var/local/jdk /var/local/terracotta/bin/run-dgc.sh 2>&1 >> /var/local/log/shibboleth2-idp/run-dgc.log 2>&1
- Run this only on the Terracotta server instance which is in ACTIVE-COORDINATOR mode. The passive server will ignore this request, but set up a repetitive loop to check whether or not it can run the DGC, and will add a thread for each request made.
- Alternately, this script can be installed and used in a cron job on all servers and it will automatically determine whether it is on the active server and should run the DGC.
Log Management
At present, when Terracotta is instrumented in the client JVM, there will be a large number of warnings output to the catalina.out log (assuming you are using Tomcat). This is an issue in TC versions prior to 3.0, it was not observed in 3.x TC clusters.
If you experience this problem, there are a couple of ways to handle it. The first is to set up cronolog to manage the output of Tomcat.
To do this:
- Edit the lines which capture stdout and stderr in the $TOMCAT_HOME/bin/catalina.sh script:
Replace:With:>> "$CATALINA_BASE"/logs/catalina.out 2>&1 &
2>&1 | $PATH_TO_CRONOLOG/bin/cronolog "$CATALINA_BASE"/logs/%Y-%m-%d-catalina.out 2>&1 &
- In the IdP context deployment fragment, the option swallowOutput can be set to true, e.g.:
This allows configuration of the logback logger in the logging.xml to choose whether or not to display the warnings. This is now the default on the Tomcat preparationpage, but has only been recently added, so older installations might need to set this up.
<Context docBase="/var/local/shibboleth2-idp/war/idp.war" privileged="true" antiResourceLocking="false" antiJARLocking="false" unpackWAR="false" swallowOutput="true" /> - Using that option in your deployment fragment, if you then modify the level value in this segment of the logging.xml file, you can see the messages at the INFO level, but they stay nicely hidden at the ERROR level.
<logger name="org.apache.catalina">
  <level value="ERROR" />
</logger>
Memory Management
With Terracotta instrumented, the Eden space of the JVM fills up fast and some objects regularly spill over into the Old Generation collection. When the Old Generation collection fills up, this causes a stop the world application pause while the garbage collector runs over the space. The recommended way to handle this is to remain using the ParallelOldGC collector and simply trim your JVM memory settings so that the size of the collection is small enough to consume only a reasonable amount of time during garbage collection.
ParallelOldGC
1 GB of old generation space was found more than ample to handle even extreme load conditions. This works because when the JVM starts to fill up, Terracotta simply shunts the least frequently used objects out of memory and onto the disk backing store. If they are ever needed, they are faulted back in. Additionally, using MaxGCPauseMillis will give the garbage collector a clue about how long your maximum pause times should be and will get it to adjust the JVM memory sizes to result in only short pauses when it comes time to collect the old generation. Here are the combined recommended settings to achieve this effect:
-Xms1G
-Xmx1G
-XX:+UseParallelOldGC
-XX:MaxGCPauseMillis=5000
-XX:+PrintGCDetails
-XX:+PrintGCTimeStamps
-XX:-TraceClassUnloading
You can set the number of milliseconds as you see fit. The more milliseconds you give it, the greater size will be allowed for the old generation. Other options as recommended by other documents such as JVM Tuning should still be used, e.g. -server, -XX:MaxPermSize=1G, etc. Do not use -XX:+AggressiveOpts, as this has been found to enable an experimental TreeMap object (as of JVM 1.6.0_14) which so far is incompatible with clustering.
The number and speed of processors has a marked effect on the garbage collection time. When a stop-the-world collection is done, the work is split amongst the processors by the use of ParallelOldGC, so the response time is directly related to processor effectiveness.
ConcurrentMarkSweepGC
When clustering was first piloted, the recommended way to avoid long pause times was the use of the ConcurrentMarkSweepGC. This was proven workable and has been run for about a year at USC. This option is no longer recommended because of the very infrequent but regular occurrence of a failure of the collector usually due to memory fragmentation which causes a long pause for a single-threaded sweep and reorganization of the entire memory space. This can take an excessively long time (e.g. 40 seconds the users are forced to wait and are piling up connection requests) and is not a suitable tradeoff when compared with, for example, frequent 5 second old-generation collections. ("Frequent" depends on many factors, your results will vary and should be tuned according to your architecture.)
Further, ConcurrentMarkSweepGC is specifically designated as unsupported by Terracotta.
If you do wish to play with this option, here are the details:
You must tune your heap large enough so that occurrences of defragmentation will be minimal; however your heap must not be so large that when a stop-the-world defragmentation does occur, it does not take so long that the servers disconnect from one another (60 seconds for example). At USC on Sun v440s, up to about 3 GB was workable, but larger than that caused pause times to get too long.
In the Tomcat JVM options, instead of -XX:+UseParallelOldGC, use the following:
-XX:+UseConcMarkSweepGC
-XX:+CMSIncrementalMode
-XX:+CMSIncrementalPacing
-XX:CMSIncrementalDutyCycleMin=0
-XX:CMSIncrementalDutyCycle=10
-XX:+PrintGCDetails
-XX:+PrintGCTimeStamps
-XX:-TraceClassUnloading
-XX:+UseParNewGC
Provisos:
- As mentioned above, this should only be used where the IdP has plenty of heap space in which to operate, but not too much. Failure to have enough heap space may wind up forcing the collector into a lengthy stop-the-world memory defragmentation cycle. Too much heap causes excessive pause times in the rare case that a defragmentation does occur.
- This collector will still show occasional application pauses for memory defragmentation depending on your settings.
- This is experimental and was successfully used at USC for one year; your results may vary. This option is being retired at USC in favor of a trim 1 GB heap, and the ParallelOldGC collector.
Server Connections for High Availability:
Slight network hiccups can cause one or more of the servers to disconnect from the others. This can lead to problems like two or more Terracotta servers trying to operate in ACTIVE-COORDINATOR mode. The Terracotta servers can recover from this, but upon recovery, Tomcat clients may become orphaned and have to be manually restarted. To fix this, the options described on this page should be used to enable reconnect capability:
Configuring Terracotta for High Availability
Here is a sample snippet of configuration code to place at the top (as the first element) of the tc-config.xml file to enable these options. Make sure all servers and clients are restarted with these in effect or connections may be rejected where the settings differ.
<tc-properties>
  <property name="l2.nha.tcgroupcomm.reconnect.enabled" value="true" />
  <property name="l2.nha.tcgroupcomm.reconnect.timeout" value="15000" />
  <property name="l2.l1reconnect.enabled" value="true" />
  <property name="l2.l1reconnect.timeout.millis" value="15000" />
</tc-properties>
Advanced Configuration and Issues
Many details in regards to setting up a finely tuned and robust cluster were discoverd during detailed load testing. The most critical of these issues are covered above, but advanced deployers and those wishing to do further testing may find this information useful.
Heap spaces
In addition to the data described in the "Memory Management" section above, more details may be of interest.
When using Terracotta, better performance is observed in the Tomcat server when using a smaller heap size, about 1G. This smaller heap space allows for quicker turnaround time in garbage collection cycles. It is workable because any excess objects, which formerly would have filled up memory, will be faulted back to the TC store. In addition to this, having a cluster automatically involves the idea of multiple nodes which will then share the memory burden and reduce the memory requirements for each individual node. A proper distribution of connections, with appropriate persistence settings, will maintain sessions in the memory space of the original node for each user and only the least frequently used items will be faulted back. Furthermore, a reduced heap size also reduces the burden on the Terracotta Virtual Memory Manager (VMM). The VMM has a burden of deciding which objects should be faulted back to the TC server, and also from there, out to disk. With a large heap space, a large number of session objects will be in memory when the VMM is invoked. The VMM may have to examine very large numbers of objects and potentially evict a large quantity of objects. Some of these cycles also subject the cluster to pauses (and not always just the individual client JVM). Keeping the server trim will allow quick turnaround on these processes.
The drawback of a trim heap is simply that fewer sessions can be kept in memory, so a user who has been absent from his session for a long while may find the cluster needed to pull his session info off of the active TC server disk resulting in a longer pause for that user. Given that a single node probably has very few currently active requests, the heap space can be quite small before the number of simultaneous users could exceed the currently available space for session objects.
TC cache sizes and resizing
The TC cache can have a significant impact on performance. Objects are held in memory until memory fills up and then objects begin to be selected for offloading to disk. Too little cache will cause disk lookups for offloaded sessions; while too much cache can result in significant overhead in examining objects for eviction
Many configuration options exist for tweaking the TC internal cache. Default cache settings will do the job for most installations. Level 2 (l2) is presented here, and indicates the options for the TC server. These same options exist in the TC client (the tomcat server or other web container for the IdP) but tweaking there is much less likely to be needed.
- l2.cachemanager.percentageToEvict - What percentage to evict. Should be set low - will increase frequency of eviction but reduces pause times on each eviction cycle.
- l2.cachemanager.criticalObjectThreshold - if set, the percentage in l2.cachemanager.percentageToEvict is evicted plus whatever else is needed to reduce the cache below the critical threshold. Eviction based on this threshold is only done when one of the memory-size cache triggers is tripped. This can be dangerous if there are millions of objects to be evicted at once; the pause time for this can be excessive. This option should not be configured. Automatic dynamic cache management based on heap percentages works much more reliably (the default).
- l2.cachemanager.leastCount - triggers virtual memory management on this specified percentage rise or fall in memory usage (TC docs say just 'rise' but it happens on any delta of this magnitude). Should be set low to trigger more frequent inspections which will give a smaller total eviction count each time. Default value of 2 is fine so you shouldn't need to set this.
- l2.cachemanager.sleepInterval - time between memory inspections. Shouldn't need to set this since TC will automatically adjust this.
- l2.cachemanager.threshold - begins the process of using the VMM. Only after this threshold is reached will the percentage changes in memory specified by leastCount or sleepInterval take effect.
- l2.cachemanager.logging.enabled - useful to set to log messages about when evictions are triggered, how many objects are evicted, and other bits of relevant data. Sufficiently concise logging for use in production.
Terracotta documentation contains full definitions for these options here: Tuning the Terracotta VMM
Large Scale Deployments
Total Number of Session Objects
In a large scale deployment, as demonstrable by hitting a cluster with excessive load testing, the total number of session objects can overwhelm the disk store and even the memory space of the Active TC server. Terracotta can effectively handle huge numbers of session objects and keep space in the various JVMs open, but even with the ability to offload to disk, there is a limit. After hundreds of thousands of logins are recorded, the disk space can fill up. An average day at USC leaves us with a disk store of 2 GB for around 70,000 to 100,000 logins. Multiply this by the number of GB available (around 60 in our server) and we have then a limit of 3,000,000 logins. Quite an unlikely number for a day at a university, but certainly a possibility for a popular nationwide service or important central IdP with many popular SPs.
If the Active TC server JVM space is kept small, then, prior to filling the disk we also run into an upper bound on session objects which can be listed, even though the actual objects are mostly on disk. Terracotta cannot shunt all information to disk. A minimal amount of memory must be retained on each object simply to keep a list of all objects being tracked. In particular, when the key to the object is a sizable object such as a long string, this limit can be reduced. There may be room for the IdP developers to remove complicated string keys in favor of object pointers as a key, and this would increase the total possible list size, but that would only be necessary if/when a huge-scale deployment was needed somewhere (and other workarounds are possible).
A good way to manage the total number of session objects if this becomes a problem is to reduce the total session lifetime so that it can be garbage collected sooner, then the Disk Garbage Collector can be run more frequently to clean out the old disk objects. Extra processing power will be needed to run the DGC more often without bogging other services. Also, the Young Generation Collector can be used to try to clean up defunct session objects before they end up on disk.
Young Generation Collector
The young generation collector may be valuable where session lifetimes in the IdP are short, huge numbers of logins occur (and hence need to be cleaned up in a timely fashion), and memory and disk sizes are tight. The young generation collector can pull defunct objects out of the TC virtual memory manager and save the Disk Garbage Collector from extra work later. The young generation collector handles objects which have not yet faulted to disk, but yet are no longer referenced in any client JVM. This is configurable via these options (runs every ten minutes in this example):
<property name="l2.objectmanager.dgc.young.enabled" value="true" />
<property name="l2.objectmanager.dgc.young.frequencyInMillis" value="600000" />
If the DGC takes too long each night and runs into the day, shorter session lifetimes and use of the Young Generation Collector might save load on the DGC.
Distributed Cache Manager
The distributed cache manager could be critical to large scale deployments with more than hundreds of thousands of logins per day. The need for this arises out of the growth of the TC backing store of data on disk. If session life is kept long, and the disk garbage collector is not run frequently, sessions may build up on disk and fill it, or bog down the server when it actually comes time to collect. Short session lifetimes, running the young generation collector, and running the full disk garbage collector often may be critical for large scale deployments. This may be alleviated by the distributed cache TC offers, but this cache has not yet been investigated or tested for deployment. It is mentioned as an alternative for someone to investigate who is contemplating a huge deployment.
Response Times Under Load
Responsiveness is uniform. Response times rise in direct proportion to the number of simultaneously active requests. For instance at 50 simultaneous requests (divided between two Sun v440s), average response time was 5.5 seconds with a standard deviation of 3.7 seconds. At 100 simultaneous requests, response time averaged 11.1 seconds with a standard deviation of 5.7 seconds. Each mark on the chart below was generated by throwing 200,000 login requests at two Sun v440s using the specified number of Grinder threads. 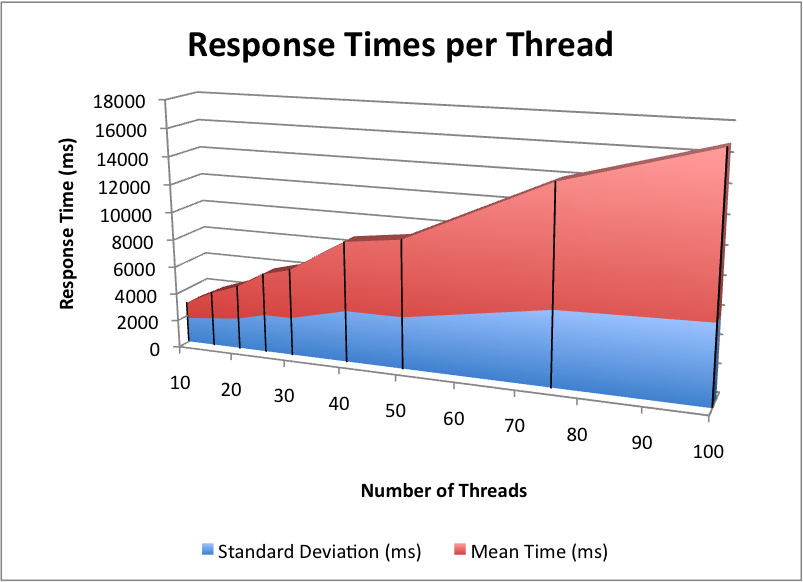
Responsiveness above and beyond this scale can still be achieved with a proportionate increase in average response time. With the proper tuning, the cluster can be hit with very large numbers of simultaneous connections without breaking, simply taking a long time to respond (as would be expected). If the JVM memory parameters and the Terracotta VMM settings are incorrect, loading up the server like this can lead to cluster disconnects and other problems requiring manual intervention to restore services.
Configuring the Terracotta Concurrent Distributed Map
By default the shibboleth package does not use a terracotta distributed map object. The regular ConcurrentHashMap is poorly performant in a distributed environment and therefore the ConcurrentDistributedMap was developed to enable better clustering of data without having to spread the data to each node of the cluster at all times. Performance in a clustered setting is significantly (50-100% approximately) better with this enabled, especially in the garbage collection behaviors.
To configure this option, it will be necessary to customize the shibboleth common package which is part of the IdP. The following instructions are approximate and apply to the 2.3.3 version of the IdP. If the code in your version is significantly different, this probably won't work for you. If code in your version is slightly different, be sure to adjust to use the SVN tag for your version of the IdP and the TC jar file from your version of TC.
Find the EventingMapBasedStorageService.java file:
src/main/java/edu/internet2/middleware/shibboleth/common/util/EventingMapBasedStorageService.java
Use the following svn diff to install changes to the file:
$ svn diff EventingMapBasedStorageService.java
Index: EventingMapBasedStorageService.java
===================================================================
--- EventingMapBasedStorageService.java (revision 1000)
+++ EventingMapBasedStorageService.java (working copy)
@@ -48,7 +48,7 @@

     /** Constructor. */
     public EventingMapBasedStorageService() {
-        store = new ConcurrentHashMap<String, Map<KeyType, ValueType>>();
+        store = new org.terracotta.collections.ConcurrentDistributedMap<String, Map<KeyType, ValueType>>();
     }

     /** {@inheritDoc} */
@@ -105,7 +105,7 @@
         synchronized (store) {
             partitionMap = store.get(partition);
             if (partitionMap == null) {
-                partitionMap = new ConcurrentHashMap<KeyType, ValueType>();
+                partitionMap = new org.terracotta.collections.ConcurrentDistributedMap<KeyType, ValueType>();
                 store.put(partition, partitionMap);
             }
         }
Find the pom file at the root of the shibboleth common tree and use the following svn diff to enable the above to compile:
$ svn diff pom.xml
Index: pom.xml
===================================================================
--- pom.xml     (revision 1000)
+++ pom.xml     (working copy)
@@ -24,6 +24,27 @@
     </properties>

     <repositories>
+    <repository>
+      <id>terracotta-repository</id>
+      <url>http://www.terracotta.org/download/reflector/maven2</url>
+      <releases>
+        <enabled>true</enabled>
+      </releases>
+      <snapshots>
+        <enabled>true</enabled>
+      </snapshots>
+    </repository>
+    <repository>
+      <id>jboss-repository</id>
+      <url>https://repository.jboss.org/nexus/content/repositories</url>
+      <releases>
+        <enabled>true</enabled>
+      </releases>
+      <snapshots>
+        <enabled>true</enabled>
+      </snapshots>
+    </repository>
+
         <repository>
             <id>shib-release</id>
             <url>https://shibboleth.net/nexus/content/groups/public</url>
@@ -68,6 +89,17 @@
             <artifactId>janino</artifactId>
             <version>2.5.10</version>
         </dependency>
+    <dependency>
+      <groupId>org.terracotta.toolkit</groupId>
+      <artifactId>terracotta-toolkit-1.2</artifactId>
+      <version>3.1.0</version>
+            <exclusions>
+                <exclusion>
+                    <groupId>commons-logging</groupId>
+                    <artifactId>commons-logging</artifactId>
+                </exclusion>
+            </exclusions>
+    </dependency>
         <dependency>
             <groupId>org.jgrapht</groupId>
             <artifactId>jgrapht-jdk1.5</artifactId>
Compile the shibboleth-common jar file with maven and put the resulting file into the shibboleth installation lib directory. Additionally you will have to install the terracotta runtime jar file along with this. From the root of a TC 3.5.1 tree, the following is the file necessary:
platform/modules/org/terracotta/toolkit/terracotta-toolkit-1.2/3.1.0/terracotta-toolkit-1.2-3.1.0.jar
Re-install the shibboleth IdP from that installation.
This code modification should work correctly regardless of whether TC is actively being used or not because the ConcurrentDistributedMap will revert back to a simple ConcurrentHashMap when TC is not active.