The Shibboleth IdP V3 software has reached its End of Life and is no longer supported. This documentation is available for historical purposes only. See the IDP4 wiki space for current documentation on the supported version.
Load Testing Contributed Results
This page aggregates load test results with the hope that sharing facilitates test practices and supports performance improvements in IdP software.
University of Chicago IdPv3.1.2 Test Results
Test Environment
IdP Configuration:
- CentOS 7 VM, t2.medium (2 core, 4GB RAM)
- Docker 1.6.2
- JVM: Java(TM) SE Runtime Environment (build 1.8.0_45)
- Pooled LDAP for authentication handler and attribute resolver: 12 attributes
- Servlet Container: Jetty 9.2.9.v20150224
Test client:
- Single test node running JMeter 2.13 command line client on Windows 7 with 8G RAM and 2 CPUs.
- Test client connected to IdP via network.
Test Plan
The shibboleth-unsolicited-sso-test.jmx test plan has two different test cases. The first test case issues an HTTP GET to the UChicago NotSilver SSO endpoint, which responds with a login form. The test then sends a POST to the login form to get a SAML2 response which is then sent as a POST to the IdP to complete the authentication and generate an encoded SAML assertion in the response. The second test case spawns threads that issue an HTTP GET to the unsolicited SSO endpoint, which responds with a login form. The test then sends a POST request with credentials to complete the authentication and generate an encoded SAML assertion in the response. These test cases were ran using a 15 minute run-time over a various amount of threads until the SP and the IdP were unable to handle any more threads.
Test Results
Unsolicited SAML Response
| Thread Count | 1 | 5 | 10 | 25 | 50 | 75 | 100 | 125 | 200 | 400 | 750 | 1000 | 1500 | 2000 | 2500 | 3000 | 3500 | 4000 |
|---|---|---|---|---|---|---|---|---|---|---|---|---|---|---|---|---|---|---|
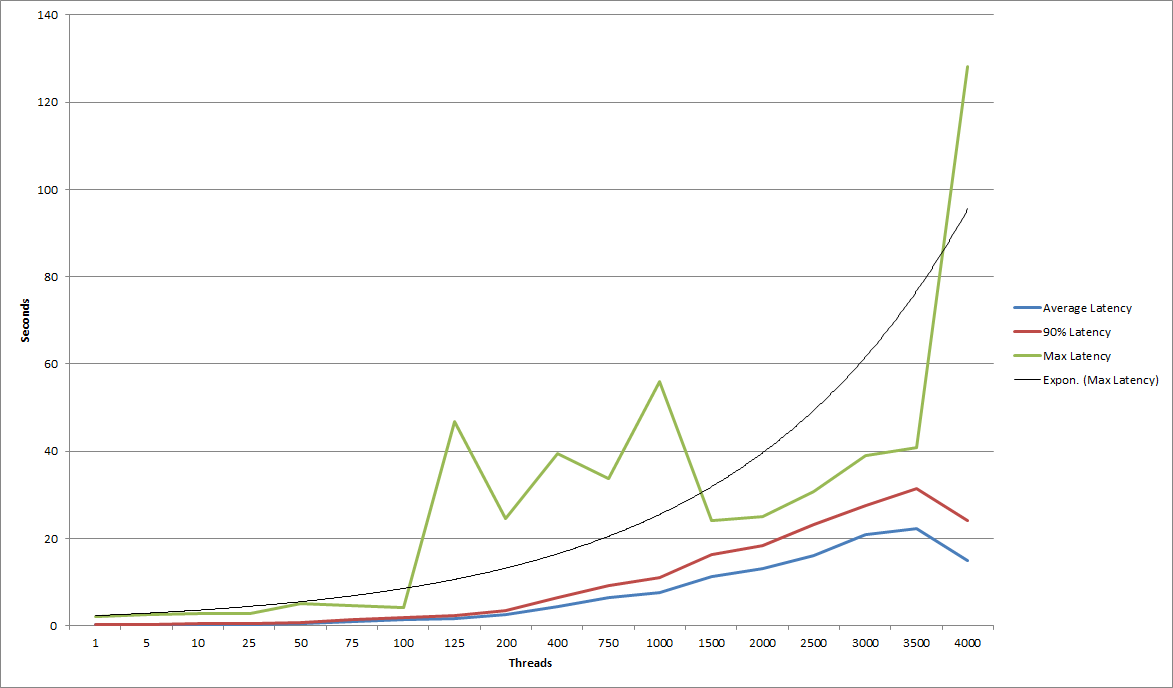
| Average Latency | 0.187 | 0.207 | 0.31 | 0.279 | 0.528 | 0.99 | 1.333 | 1.562 | 2.423 | 4.372 | 6.403 | 7.476 | 11.298 | 13.024 | 16.074 | 20.761 | 22.305 | 15.003 |
| 90% Latency | 0.267 | 0.296 | 0.492 | 0.383 | 0.735 | 1.382 | 1.891 | 2.327 | 3.504 | 6.332 | 9.079 | 10.986 | 16.244 | 18.431 | 23.147 | 27.514 | 31.505 | 24 |
| Maximum Latency | 1.971 | 2.44 | 2.671 | 2.759 | 5.023 | 4.573 | 4.041 | 46.695 | 24.504 | 39.464 | 33.667 | 55.925 | 23.99 | 24.986 | 30.745 | 38.887 | 40.832 | 128.076 |
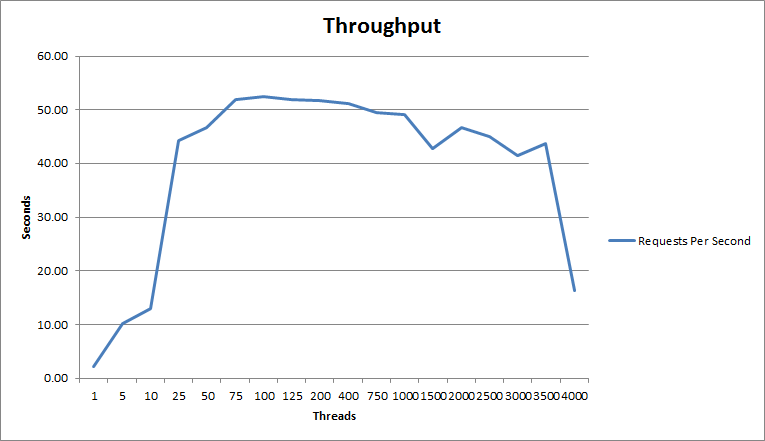
| Requests Per Second | 2.15 | 10.22 | 13.00 | 44.30 | 46.72 | 51.91 | 52.50 | 51.92 | 51.71 | 51.08 | 49.47 | 79.22 | 42.81 | 46.78 | 45.07 | 41.50 | 43.65 | 16.30 |
Observations/Interpretation
- Throughput remained minimal until a user count of about 25.
- After this initial ramp up of the throughput it remained excellent until the IdP was unable to handle any more traffic.
- The load did have an impact on the average latency, yet this value remained relatively low.
- Average latency remained under 5 seconds until 750 threads test, under 10 seconds until 1500 threads test, and under 15 seconds until 2500 threads test .
- The max latency remained relatively low until about 125 users where it jumped up into non-ideal response times.
- These non-ideal max response times remained consistent until the IdP was unable to handle any more traffic.
- Shown in another test the performance ceiling of the SP was significantly lower than the IdP performance ceiling.
- At 1500 threads the SP for UChicago was unable to respond, and required a restart to resume traffic.
- At 4000 threads the IdP became unresponsive, however after traffic was reduced it was able to recover without a restart.
- The HTTP GET SSO endpoint was the leading failure point of the IdP test case.
University of Memphis IdPv3.1.1 Test Results
Test Environment
IdP Configuration:
- CentOS 6 VM with 12G RAM, 1 CPU socket - 4 cores.
- Cisco ACE SLB.
- JVM: Java(TM) SE Runtime Environment (build 1.8.0_31-b13)
- JVM configuration flags:
-server -Xms512 -Xmx4000m - Pooled LDAP for authentication handler and attribute resolver: 12 attributes
- Servlet Container: Jetty 9.2.7
Test Plan
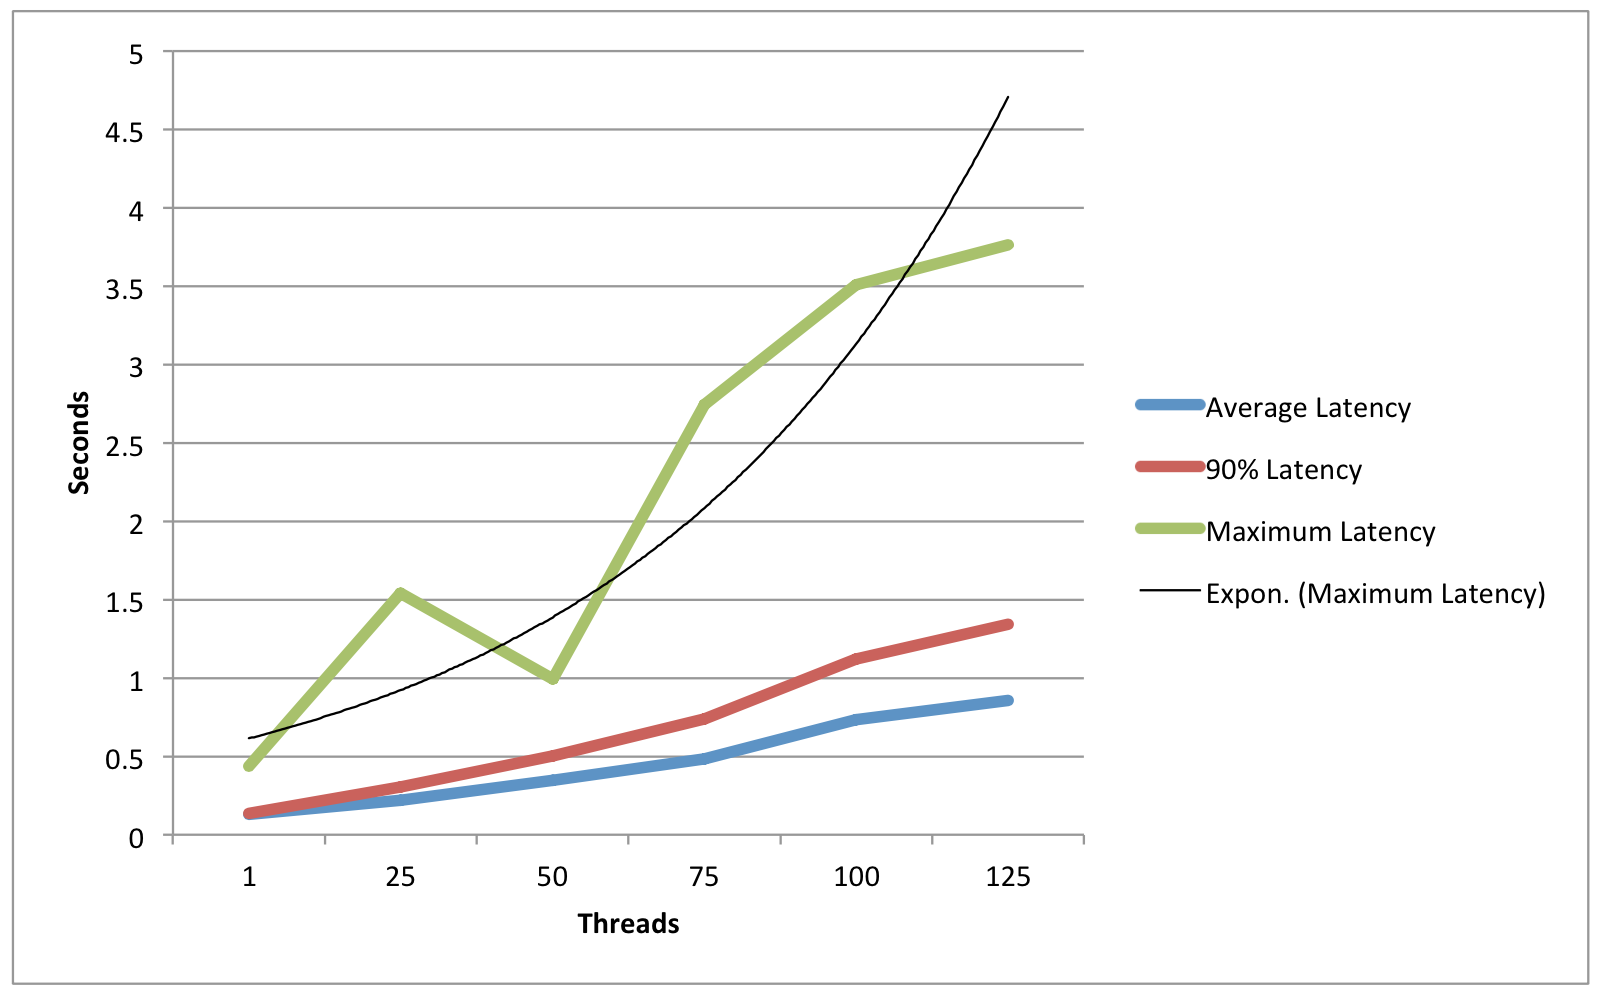
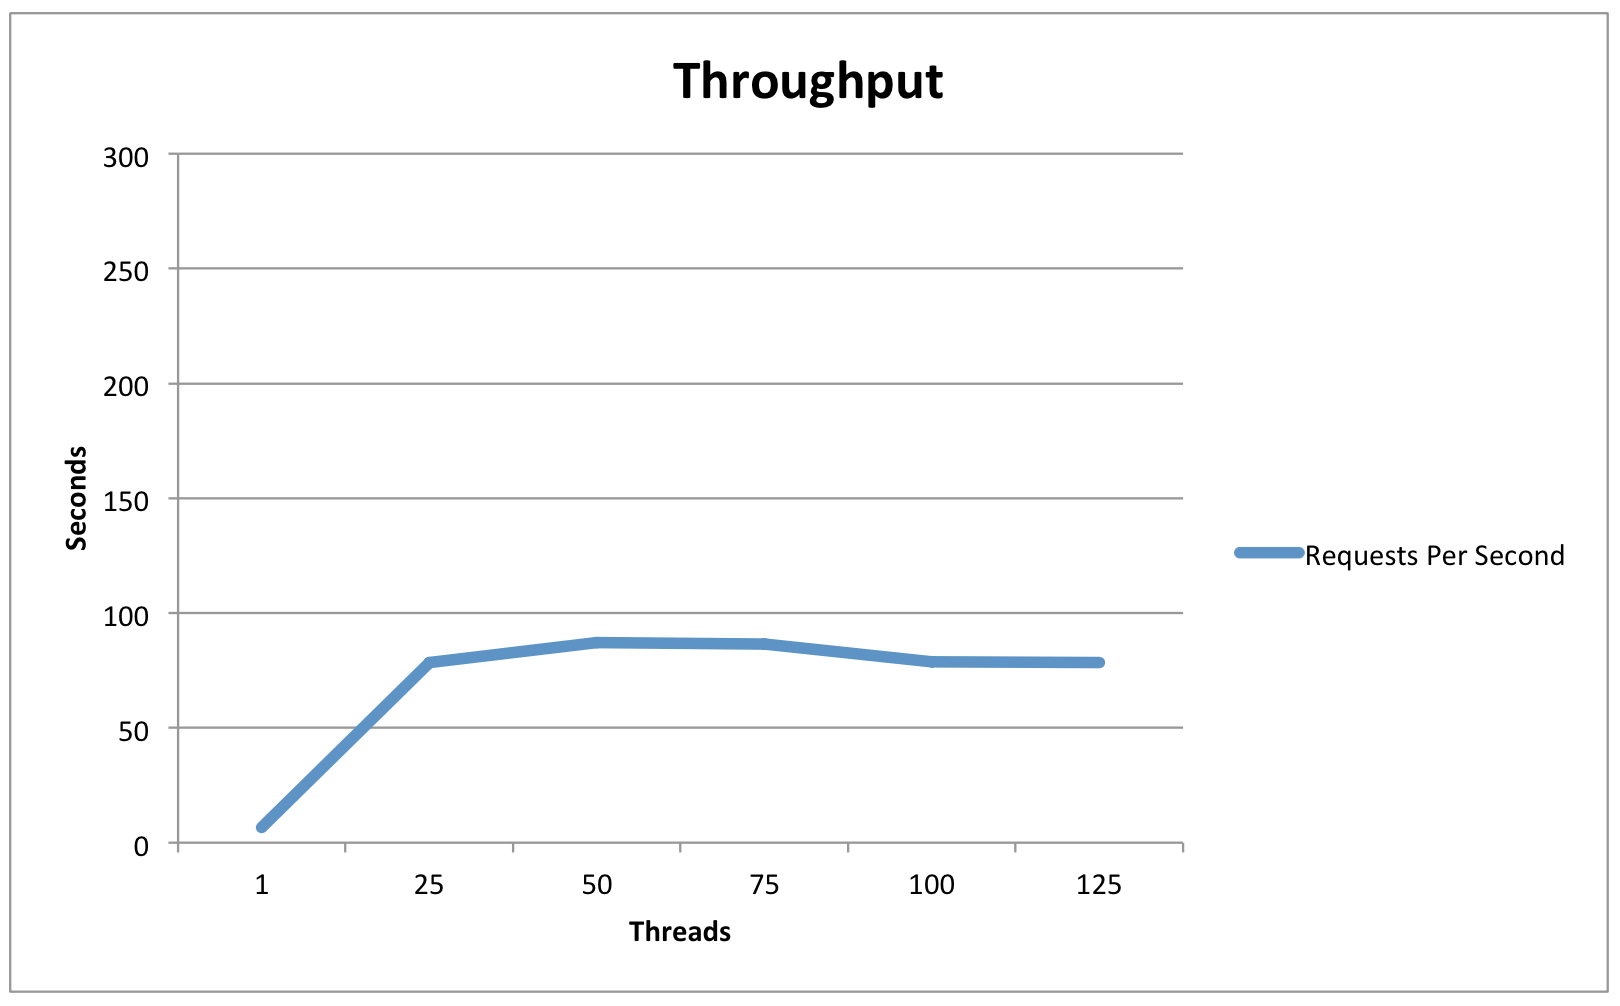
The shibboleth-unsolicited-sso-test.jmx test plan was executed against three different IdP configurations. Each configuration was hit successively with 1, 25, 50, 75, 100, and 125 threads. In all cases the IdP was configured to encrypt SAML Assertions. Latency times are in seconds and reflect the "POST Login Credentials" portion of the test.
Test Results
Single IdP Host - Memory-based StorageService
| 1 | 25 | 50 | 75 | 100 | 125 | |
|---|---|---|---|---|---|---|
Average Latency | .129 | .222 | .345 | .485 | .736 | .855 |
90% Latency | .136 | .306 | .501 | .737 | 1.122 | 1.345 |
Maximum Latency | .437 | 1.54 | .993 | 2.746 | 3.509 | 3.765 |
Requests Per Second | 6.6 | 78.5 | 87 | 86.5 | 78.7 | 78.3 |
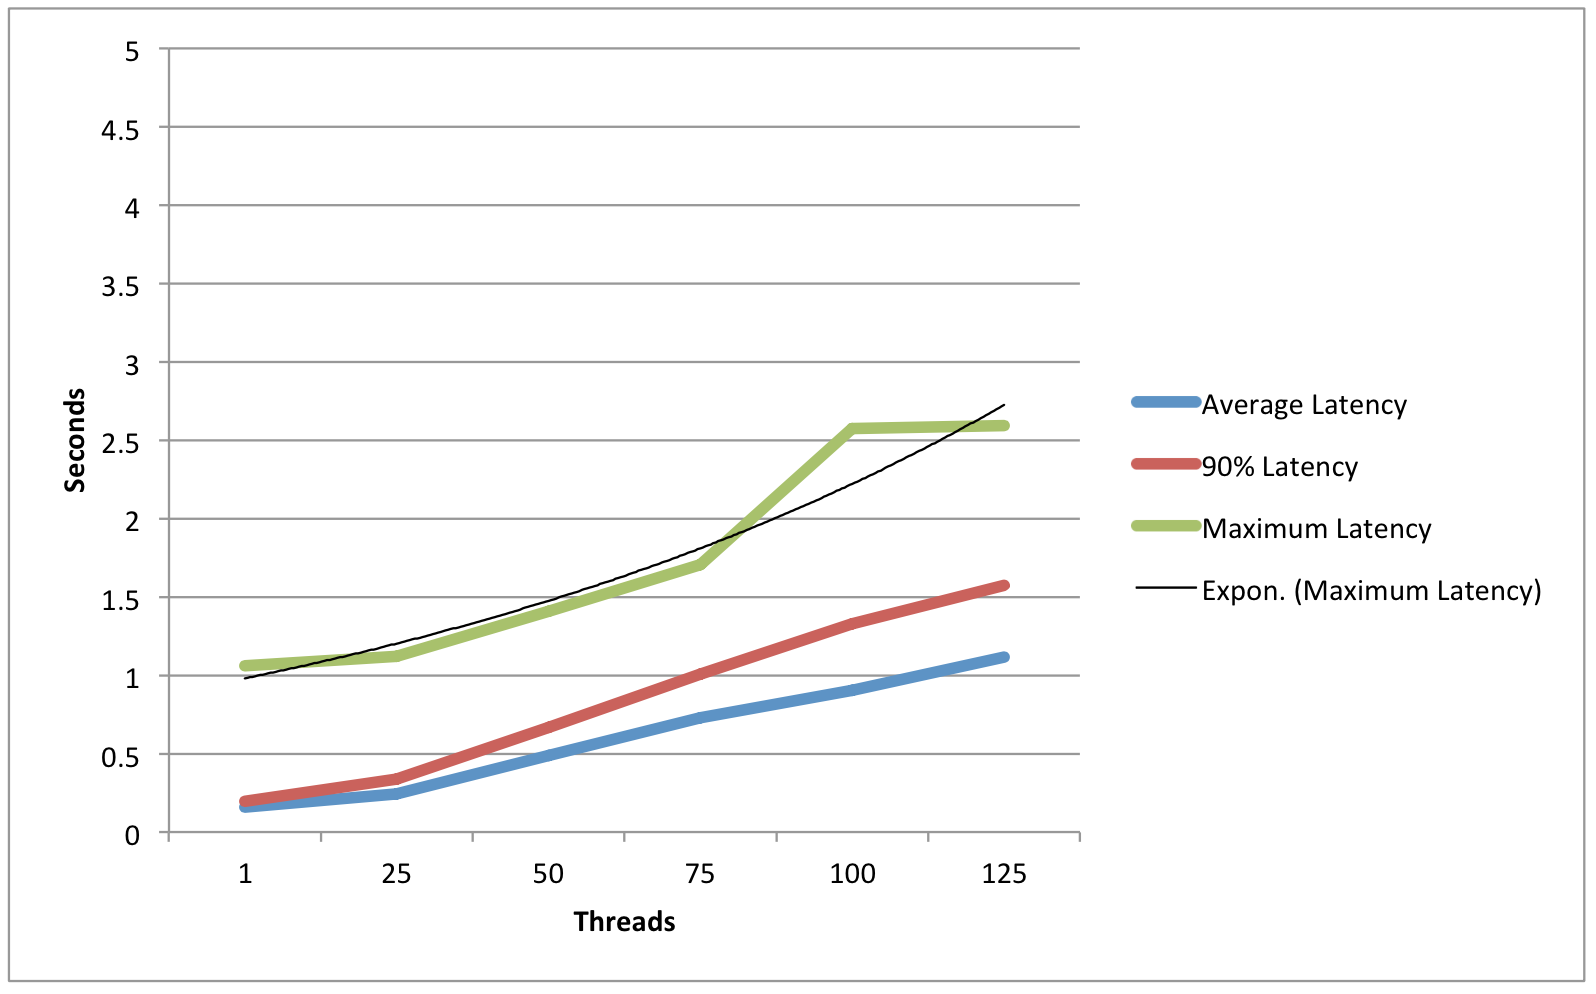
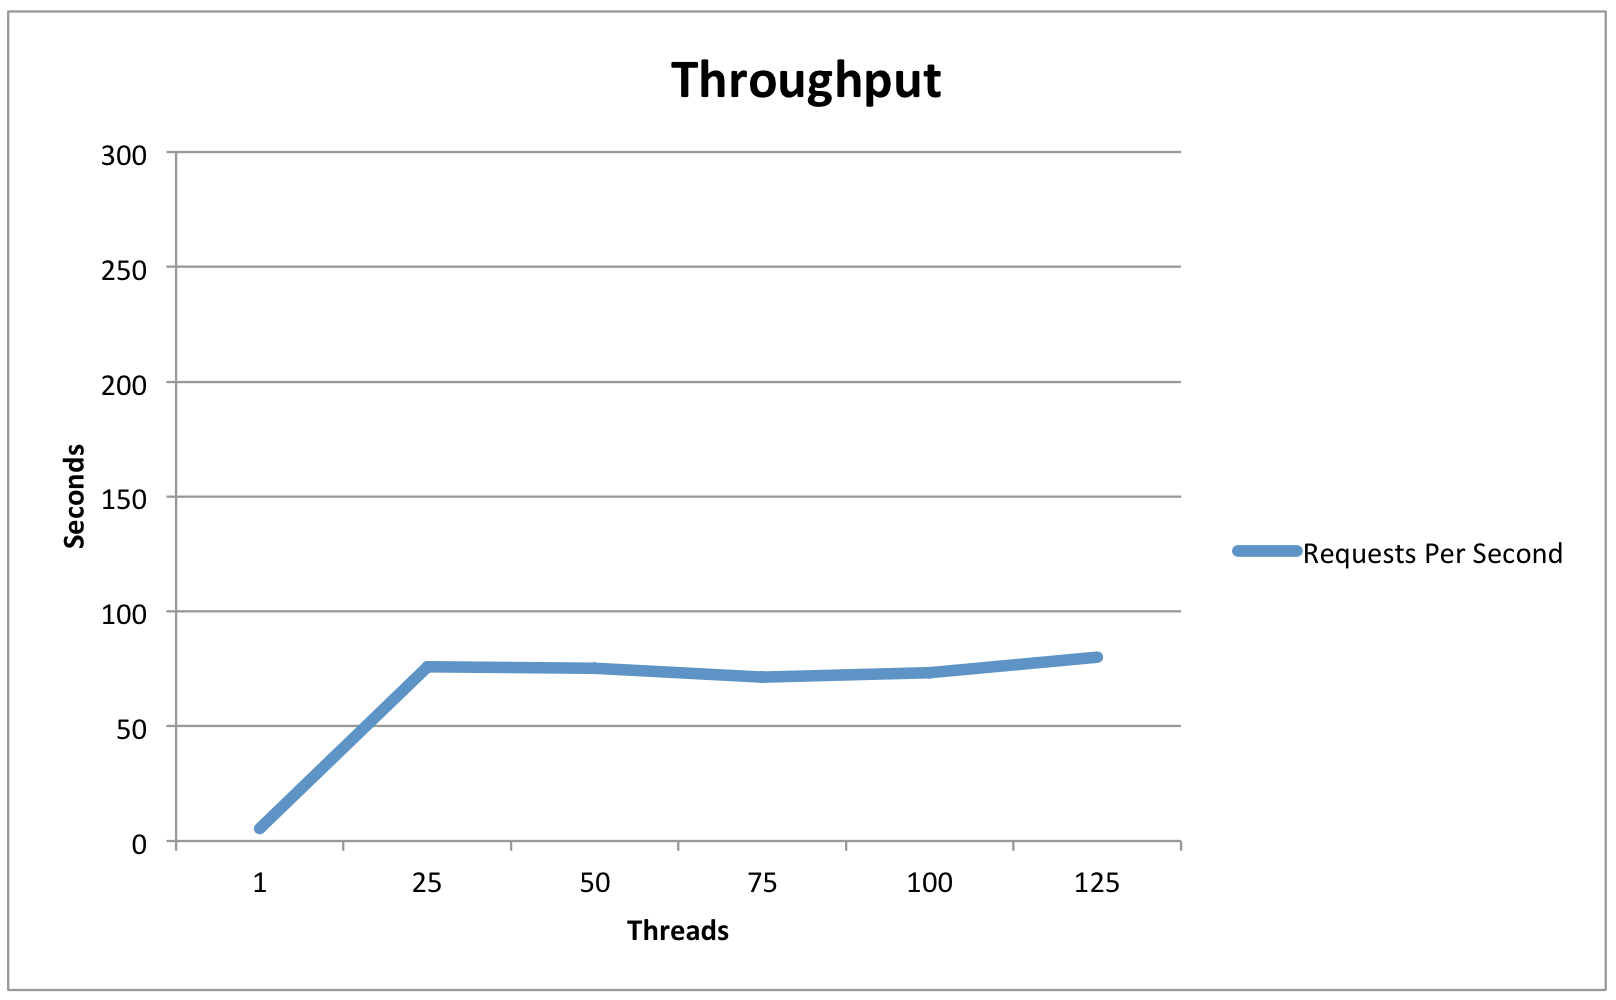
Single IdP Host - JPA-based StorageService (remote postgres)
| 1 | 25 | 50 | 75 | 100 | 125 | |
|---|---|---|---|---|---|---|
Average Latency | .159 | .245 | .488 | .729 | .905 | 1.115 |
90% Latency | .195 | .34 | .67 | 1.008 | 1.327 | 1.576 |
Maximum Latency | 1.061 | 1.121 | 1.409 | 1.705 | 2.574 | 2.596 |
Requests Per Second | 5.4 | 76 | 75.3 | 71.2 | 73.4 | 80 |
Three Node IdP Cluster - JPA-based StorageService (remote postgres)
| 1 | 25 | 50 | 75 | 100 | 125 | |
|---|---|---|---|---|---|---|
Average Latency | .159 | .159 | .168 | .233 | .285 | .322 |
90% Latency | .195 | .21 | .224 | .327 | .39 | .45 |
Maximum Latency | 1.061 | .493 | 1.102 | 2.43 | 1.239 | 1.875 |
Requests Per Second | 5.4 | 127.3 | 146.3 | 215.6 | 240.9 | 254.8 |
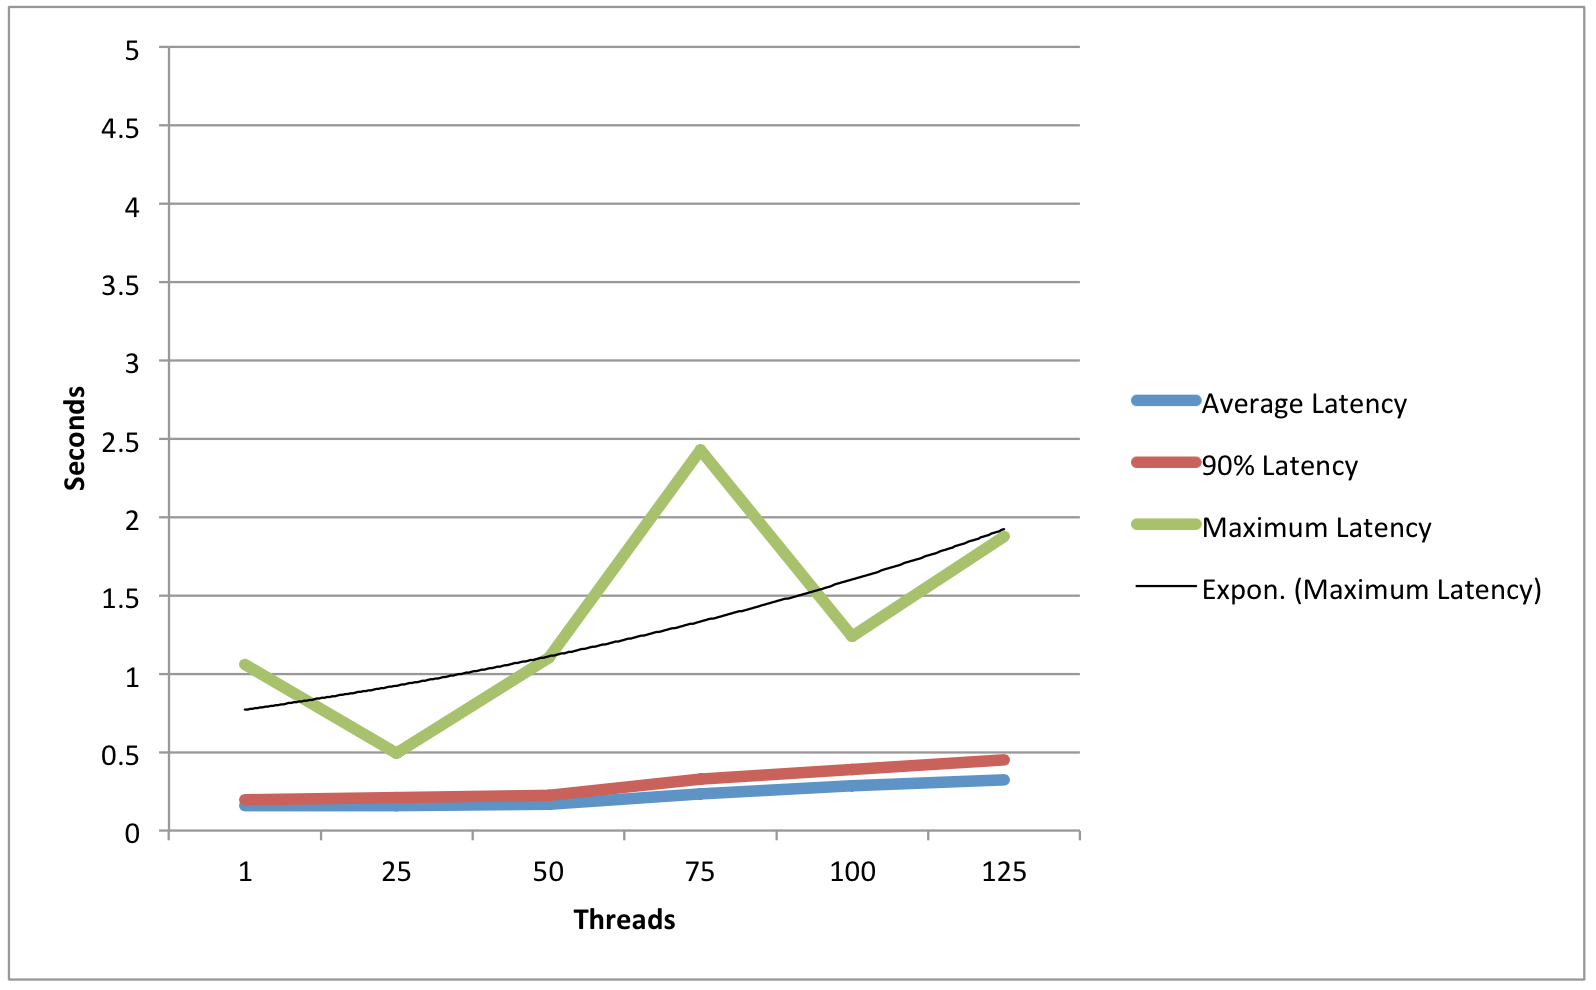
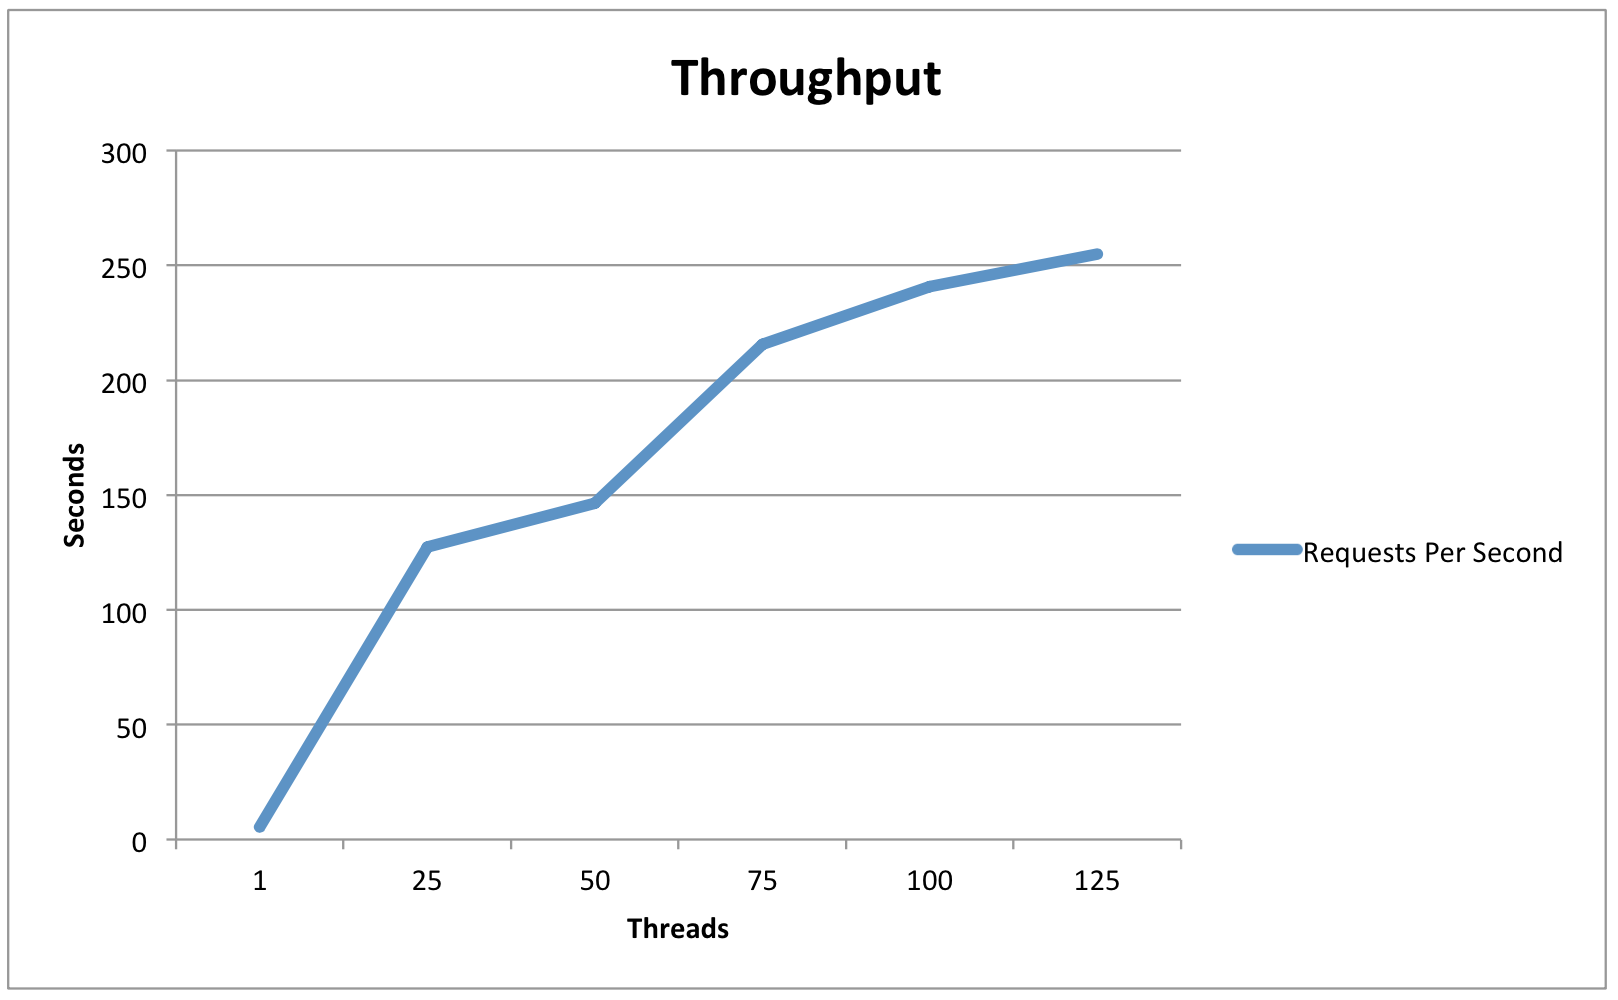
Observations/Interpretation
- While load had an impact on average latency, throughput remained excellent even in high-load situations.
- Usage of the JPA data store had a small latency cost (Roughly 10% ?).
- In light-load situations, the in-memory session cache had a throughput advantage, while in high-load situations the database cache performed slightly better.
- Throughput seems to be limited by CPU (because of the cryptographic operations) and latency is determined primarily by the responsiveness of back-end infrastructure (LDAP/DBs).
- At no point did the postgres DB server appear to be under significant stress.
- It is unlikely that this test plan found the actual performance ceiling of the 3-node cluster, since the network interface of the JMeter host was pegged during the 125-thread test.
High Session Count
Another area of interest was the extent to which “high” session counts adversely affect the overall performance of the IdP. Although no metrics were recorded, an additional test was conducted against the "Single IdP Host - JPA-based StorageService" configuration. The IdP was preloaded with 100,000 active sessions prior to the running of a test plan with 25 threads. No discernible degredataion in latency or throughput was found.
Virginia Tech IdPv3 Alpha2 Test Results
Test Environment
IdP Configuration:
- Single IdP node running on CentOS 6 VM (Linux KVM) with 4G RAM and 2 CPUs.
- The IdP host is behind a Brocade ServerIron load balancer.
- JVM configuration flags:
-server -Xmn256m -Xms768m -Xmx2560m -XX:MaxPermSize=256M -XX:+DisableExplicitGC -XX:+UseParallelOldGC - 1 pooled LDAP authentication handler
- 2 pooled LDAP attribute resolvers: 1 for user attributes, 1 for entitlements
- MemoryStorageService
- ComputedPersistentIdGenerationStrategy
Test client:
- Single test node running JMeter command line client on CentOS 6 VM (Linux KVM) with 4G RAM and 2 CPUs.
- Test client physically near IdP connected via 1GbE links.
Test Plan
The shibboleth-unsolicited-sso-test.jmx test plan spawns 100 threads that issue an HTTP GET to the unsolicited SSO endpoint, which responds with a login form. The test then sends a POST request with credentials to complete the authentication and generate an encoded SAML assertion in the response. The assertion was encrypted in our case.
Test Results
| Test Run | Sample | Avg Latency (ms) | StDev Latency (ms) | Tput (req/s) |
|---|---|---|---|---|
| 1 | GET Unsolicited SSO URL | 309 | 228 | 85 |
POST Login Credentials | 799 | 379 | 86 | |
| 2 | GET Unsolicited SSO URL | 310 | 229 | 86 |
| POST Login Credentials | 794 | 374 | 86 | |
| 3 | GET Unsolicited SSO URL | 297 | 226 | 85 |
| POST Login Credentials | 814 | 396 | 86 |
We conducted another load test run with the YourKit Java Profiler attached to the Java process running the IdP to facilitate performance analysis under load. The IdP was started and allowed to settle down for approximately 1 minute before the test client started the test run, then the process was given approximately 30s after the test completed before a YourKit snapshot was taken. The profiler was configured for CPU sampling to provide more accurate CPU consumption details.
The YourKit snapshot (compressed) is available for detailed review using the YourKit Java Profiler application, but some highlights of the snapshot are worth noting.
CPU hot spots:
Name | Time (ms) |
org.eclipse.jetty.webapp.WebAppClassLoader.loadClass(String) | 112014 |
net.shibboleth.idp.profile.AbstractProfileAction.doExecute(RequestContext, ProfileRequestContext) | 102608 |
org.opensaml.profile.action.AbstractProfileAction.execute(ProfileRequestContext) | 102514 |
org.opensaml.profile.action.impl.EncodeMessage.doExecute(ProfileRequestContext) | 42742 |
net.shibboleth.idp.attribute.resolver.AbstractDataConnector.doResolve(AttributeResolutionContext, AttributeResolverWorkContext) | 39937 |
org.opensaml.saml.saml2.binding.encoding.impl.HTTPPostEncoder.postEncode(MessageContext, String) | 37736 |
net.shibboleth.idp.attribute.resolver.impl.AttributeResolverImpl.resolveAttributes(AttributeResolutionContext) | 25495 |
net.shibboleth.idp.attribute.resolver.impl.AttributeResolverImpl.resolveAttributeDefinition(String, AttributeResolutionContext) | 25471 |
net.shibboleth.idp.attribute.resolver.AbstractResolverPlugin.resolve(AttributeResolutionContext) | 25389 |
net.shibboleth.idp.attribute.resolver.impl.AttributeResolverImpl.resolveDataConnector(String, AttributeResolutionContext) | 20009 |
org.opensaml.xmlsec.signature.support.SignatureSupport.signObject(SignableXMLObject, SignatureSigningParameters) | 14312 |
org.ldaptive.AbstractOperation.execute(Request) | 13988 |
com.sun.jndi.toolkit.ctx.PartialCompositeDirContext.search(String, String, SearchControls) | 11008 |
java.math.BigInteger.modPow(BigInteger, BigInteger) | 10383 |
java.util.concurrent.ConcurrentHashMap.get(Object) | 9844 |
org.opensaml.saml.saml2.binding.encoding.impl.HTTPPostEncoder.populateVelocityContext(VelocityContext, MessageContext, String) | 9619 |
com.sun.org.apache.xml.internal.serialize.DOMSerializerImpl.write(Node, LSOutput) | 9180 |
java.security.SecureRandom.nextBytes(byte[]) | 9136 |
java.lang.ClassLoader.loadClass(String) | 7292 |
org.opensaml.xmlsec.encryption.support.Decrypter.<init>() | 5639 |
net.shibboleth.utilities.java.support.component.AbstractInitializableComponent.initialize() | 5622 |
Memory consumption summary:
Heap memory
- Used: 575M
- Allocated: 757M
- Limit: 2.4G
Non-heap memory
- Used: 73M
- Allocated: 73M
- Limit: 304M
Top 20 objects by memory consumption:
Name | Object Count | Shallow Size (bytes) |
char[] | 1238216 | 185583472 |
byte[] | 132567 | 77040832 |
java.util.HashMap$Entry[] | 606446 | 46840400 |
java.util.HashMap | 558435 | 31272360 |
int[] | 152186 | 28671608 |
java.lang.Object[] | 555446 | 26037176 |
java.lang.String | 1018191 | 24436584 |
java.util.HashMap$Entry | 354662 | 11349184 |
java.lang.Class | 12431 | 9054864 |
java.util.ArrayList | 344137 | 8259288 |
java.util.concurrent.locks.ReentrantReadWriteLock$FairSync | 117943 | 5661264 |
net.shibboleth.utilities.java.support.collection.LazyMap | 310478 | 4967648 |
net.shibboleth.utilities.java.support.collection.LazySet | 306181 | 4898896 |
org.opensaml.core.xml.NamespaceManager | 117941 | 4717640 |
com.sun.org.apache.xerces.internal.dom.DeferredElementNSImpl | 65170 | 4692240 |
com.sun.org.apache.xerces.internal.dom.ElementNSImpl | 71612 | 4583168 |
com.sun.org.apache.xerces.internal.dom.DeferredAttrNSImpl | 95026 | 4561248 |
com.sun.org.apache.xerces.internal.dom.DeferredTextImpl | 113595 | 4543800 |
java.util.HashSet | 241810 | 3868960 |
Garbage collection summary:
- Minor collections (PS Scavenge): 0.18/s ± 0.39/s
- Major collections (PS MarkSweep): 0