The Shibboleth IdP V3 software has reached its End of Life and is no longer supported. This documentation is available for historical purposes only. See the IDP4 wiki space for current documentation on the supported version.
IdP Heap Management
The Shibboleth IdP's periodic reloading of InCommon metadata makes effective use of heap space and garbage collection less than obvious. This page describes some of the issues and offers some suggestions.
Java Garbage Collection
Heap memory is Java's temporary storage. Management of the heap is the job of a Garbage Collector (GC). Periodically the collector looks through the heap for allocations that are no longer referenced and reclaims them (a collection), making them available for another allocation.These collections are usually Stop-the-World (STW) events---the application is paused during collection.
Garbage Collector's divide the heap into new and old areas (generations). The new generation is the most dynamic. New allocations and most collections occur here. When an object has survived several collections it is moved into the old generation. When the old generation fills a full collection is necessary to collect and reorganize memory. Old generation collections tend to cause the longest application pauses.
Java has several collector options:
- Serial GC. This is the basic, single threaded GC. It is useful on single processor machines with small heaps. Collection is STW.
- Parallel GC. This is essentially a multi-threaded version of the Serial GC. It also tends to be STW.
- Concurrent Mark Sweep (CMS). This multi-threaded collector is able to perform much of its work on the old generation in parallel with the application's normal processing. This allows it to reduce the length of STW pauses and is most useful for real-time systems, e.g. web services. CMS uses the same new generation collector as the Parallel GC. This is the default GC for Java 1.8.
- Garbage-First (G1). This multi-threaded collector attempts to meet configured maximum pause time goals. It is a compacting collector, and can often obviate full STW old generation collections. Although G1 has a sense of new and old allocations, it does not divide the heap into new and old regions.
Regardless of which you use, they all have one architectural design in common: a separation, if only logical, of the heap into 'new' and 'old' spaces, and a sense that old allocations are semi-permanent. The problem is that a Shibboleth IdP doesn't allocate memory that way, Most of the 'old' space in the IdP's heap is InCommon metadata (~500MB per parse). This is dynamic, and is completely replaced daily.
Tuning Garbage Collection for the IdP
Some considerations for IdP GC tuning:
- Each InCommon metadata in-core instance consumes about 400-500 MB.
- InCommon metadata is replaced daily, usually mid-day in the U.S.
- Most IdPs are not uniformly loaded over a 24-hour period.
- There's little point in starting out with heap space less than the maximum.
CMS Tuning
Choose CMS with the java arg (-XX:+UseConcMarkSweepGC).
Sizing the Heap
The CMS GC is fairly strict with its allocation of new and old generation heap space. For the Old Generation we need a some score of MB for non-metadata persistent allocations, and enough space for two parses of InCommon metadata—so we can refresh it without triggering a full collection. That's about a minimum of 1.5GB for the old space. The new generation is very dynamic, but the IdP doesn't require large blocks at a time. We could get by with 500MB for the new.
- 2GB total heap
- Set the new ratio so new gets 1/4 of the heap.
Args: (-Xms2g -Xmx2g -XX:NewRatio=4)
- 3GB total heap
- Set the new ratio so new gets 1/2 of the heap.
Args: (-Xms3g -Xmx3g -XX:NewRatio=1)
Timing Collection of the Old Generation
A full collection of the old generation is costly. It is STW and can easily take more than 5 seconds on a 3GB heap, 1.5-2GB old space. CMS will not run a collection on the old space until is reaches a set percentage of full. Until then no collection takes place. You might have a gigabyte of old, unreferenced metadata in the heap, but it will lay there until space is needed. To make matters worse, it will be needed exactly when many IdPs are busiest: early afternoon in the US, when InCommon releases new metadata.
A good practice might be to clean out the old junk when you're not so busy. This way you never run out of heap space during the day.
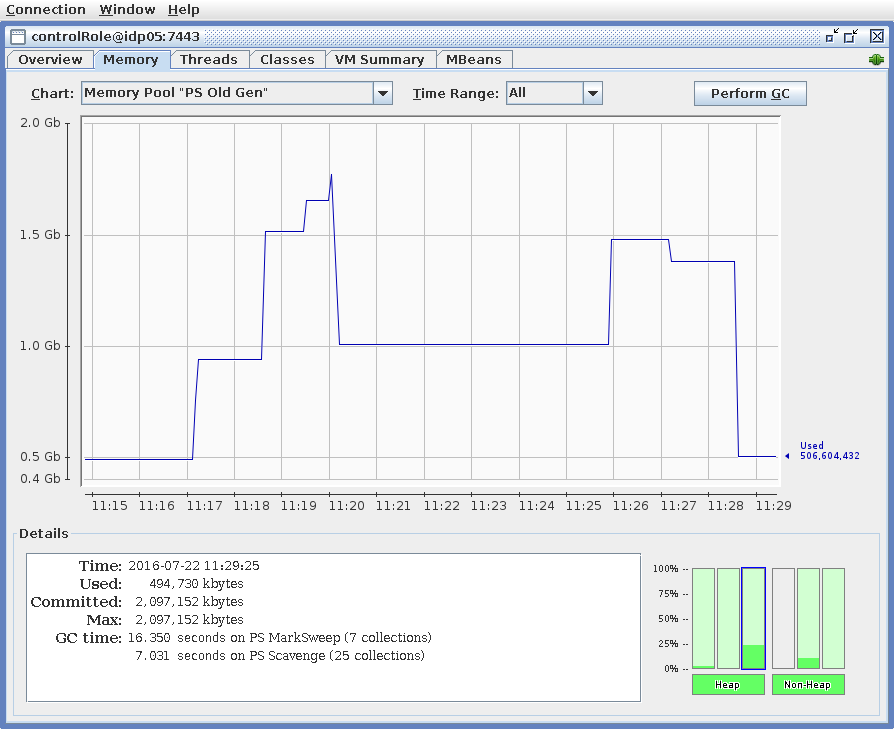
Sample CMS 'old' heap space usage
 |
|---|
- InCommon metadata refresh at 11:17, 11:18:30, 11:19:30, and 11:26.
- Force GC at 11:27 and 11:28:30.
- The third refresh triggered a full GC, lasting a total of 7 sec. But recovered only .5GB.
- A forced GC at 11:27 recovered about .1GB.
- The second forced GC recovered all unused heap space.
Suggestions
- Force a Full Collection Nightly
- Usually 2 GC runs are required to empty the Old Generation space, 10 or 20 seconds apart.
- Log GC Events
- GC logging is inexpensive and is very useful.
- Args: (-XX:+PrintGC -XX:+PrintGCDateStamps -Xloggc:<some_abs_path>)
- See also: -XX:+UseGCLogFileRotation, -XX:NumberOfGCLogFiles, -XX:GCLogFileSize
G1 Tuning
Choose G1 with the java arg (-XX:+UseG1GC).
(G1 will be the default starting about java 1.9.)
Sizing the Heap
The G1 GC is quite dynamic in its allocation of new and old generation heap space. It will collect and organize old generation heap on the fly, and will give more space to the new generations if the old space is in less demand. Remember that, at some point, you will need 1.5GB for the metadata reload. You might run into some thrashing running with only 2GB of heap.
Timing Collections
G1 adjusts its collections in order to limit application pauses to a configured target (MaxGCPauseMillis). If the target is too low each collection will not 'collect' enough free space to keep the heap sufficiently empty. If it is too long your application can experience freezes (STW events). Default MaxGCPauseMillis is 200ms. I find 400ms keeps more free space in the heap. With that setting I find there is always enough free space for the metadata rollover without needing a full collection. (In my load tests, anyway.)
- 3GB total heap
- Args: (-Xms3g -Xmx3g -XX:MaxGCPauseMillis=400)
Sample G1 heap space usage
| Old space | New (Eden) space |
|---|---|
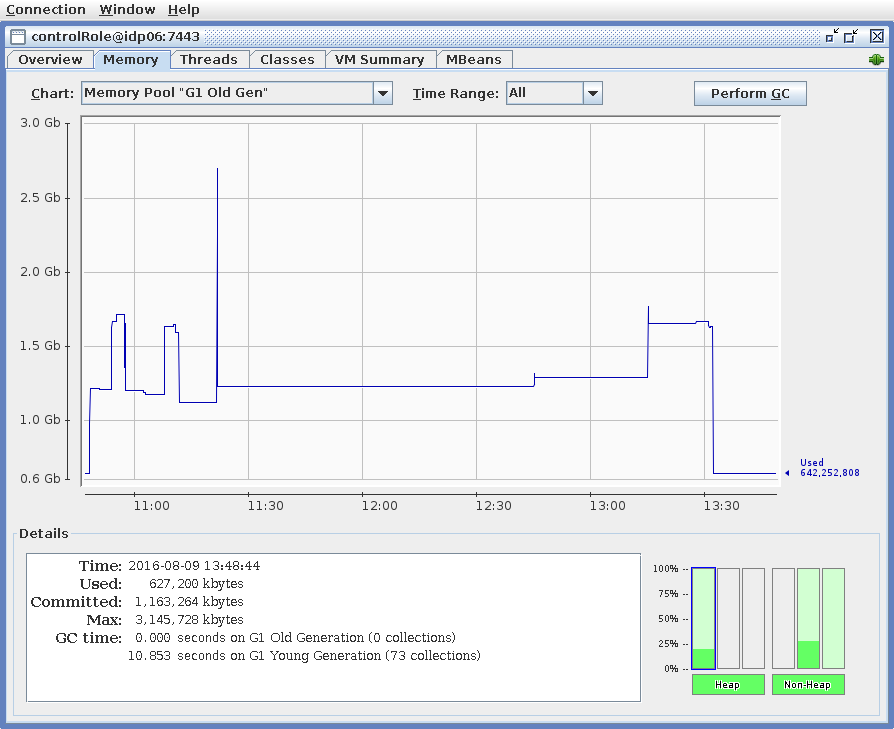 | 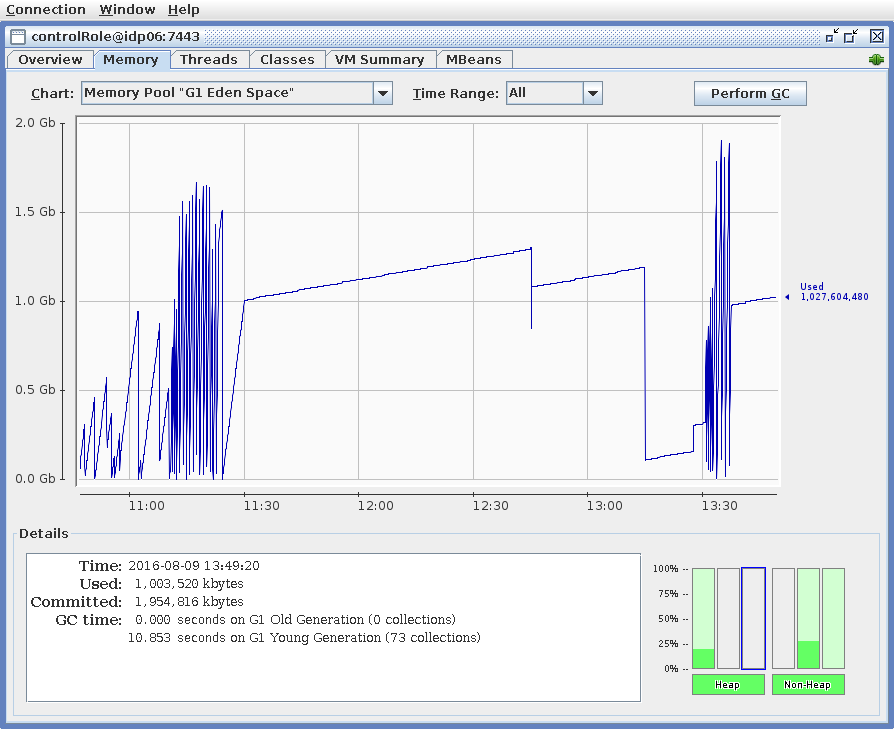 |
- InCommon metadata refresh at 10:47, 10:53, 10:57, 11:07, 11:21, 13:15.
- Light load (1-2 login/sec) from start.
- Heavy load (8-9 login/sec) 11:10-11:23, and 13:30 to end.
- The heavy load at 11:10 increased Eden space to 1.5GB, reducing old space.
- The MD refresh at 13:15 shrank Eden space to allow old space to grow without GC.
- Heavy use at 13:30 grew Eden to 2GB and emptied old of all unused space.
- No full GC was ever necessary.
Suggestions for GC Monitoring
- Log GC Events
- GC logging is inexpensive and can be very useful.
- Args: (-XX:+PrintGC -XX:+PrintGCDateStamps -Xloggc:<some_abs_path>)
- See also: -XX:+UseGCLogFileRotation, -XX:NumberOfGCLogFiles, -XX:GCLogFileSize
- The logs are text and can be easily read by eye, script or a visualizer, e.g. jvisualvm.
- Watch your IdP live
- For load test or just watching one of the IdP hosts I like to activate jmxremote and use a remote jconsole.
A Day in the Life of an IdP
This shows heap space allocations for one day for one of our IdP nodes at the University of Washington.
- Java settings: -XX:+UseG1GC -Xss24m -Xms3g -Xmx3g -XX:MaxGCPauseMillis=400
- Load: logins/min range from about 60 mid day to about 5 mid night.
| Old space | Eden space |
|---|---|
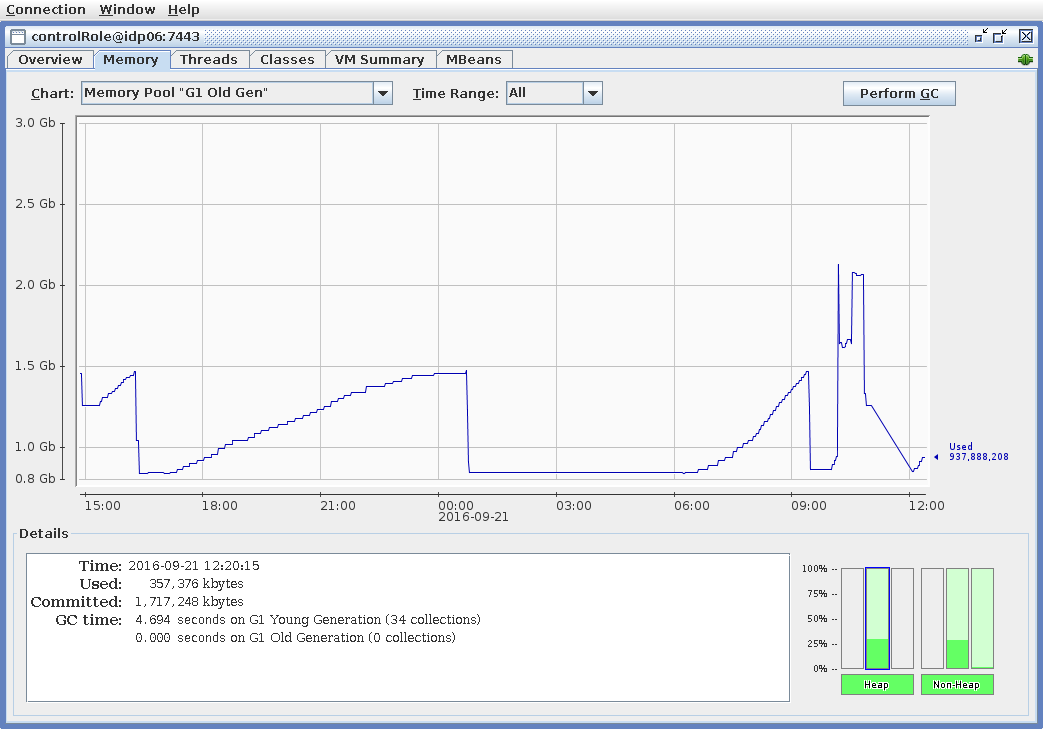 | 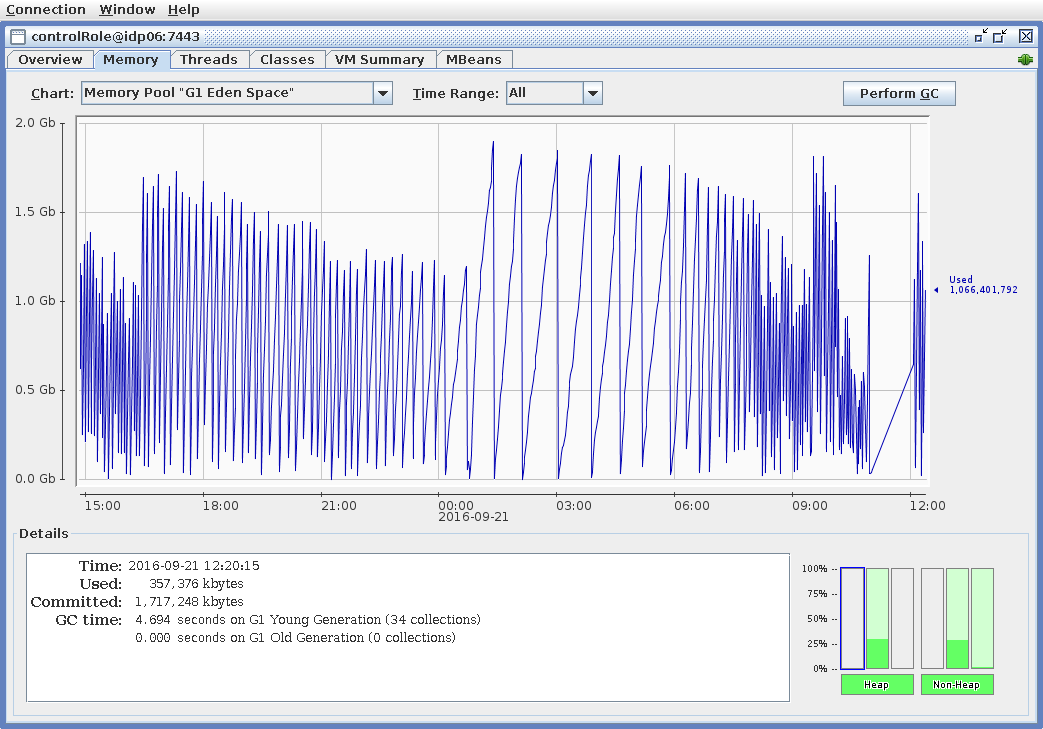 |
- Some per-request allocations migrate to old space, but are easily discarded during routine old space GC
- These didn't show in load tests
- Due to very low number of unique ids used by the load test
- The old collections at 16:00, 01:00 and 09:30 were due to a threshold (50% of total).
- Rapid increase of old use at 10:00 was due to a reload of InCommon metadata.
- Anomaly between 10:30 and 12:00 due to disconnect of jconsole.